The Cyclomatic Complexity Number of your program is a very rough measurement of how many paths can be taken through your source code. It can be calculated fully automatically. While it is far from perfect, it will give you an idea of how complex your program is. More importantly, it can also be used as a metric for the complexity evolution of a program over time. This post shows how to create this graph using some basic tools.
One of my preferred talks at Devoxx 2010 was Neal Ford’s explanation of how the design of a program emerges over time. You can watch the Implementing Emergent Design talk on Parleys (it’s not free for now, but should be within a few months) or view slides from a similar, but longer, talk he held at another time and place. Most interesting is however his series of articles on IBM’s developerWorks. It goes in-depth on all the materials presented in the slides. Very very highly recommended.
Design can emerge when you refactor code to extract patterns or design elements from existing code. But at what point do you refactor and why? The goal of most (all?) refactoring is to reduce code complexity, which can be measured up to a certain point. Cyclomatic complexity is one such measurement.
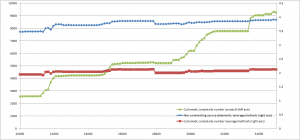
For part of a project I’m working on the graph looks like this (click for full size):
On the X axis are the Subversion revision numbers. The initial check-in of this particular bit of code was around revision 20000, hence that’s where the graph starts.
The Y axis shows:
- in green (left axis) the sum of the cyclomatic complexity of each method in the program. You can clearly see it rise as additional features are added. It never decreases, which could be a cause for concern.
- in red (right axis) the average of the cyclomatic complexity per method. This is fairly constant which is good. It should be noted that getters and setters influence this metric (they are all counted and have a CCN of 1) . So I’m not sure how valuable the average is for Java code.
- blue (right axis) shows the average number of actual code lines per method. Again this is fairly small so I think we might need to adapt the calculations to not take into account some of the basic glue code that we use so often in Java (getters, setters, builders)
In hindsight, I wish I would’ve used date labels instead of revisions, but the graph shows a good year of development time. In that year the code complexity almost quadrupled! Which will undoubtedly also affect maintenance costs and the number of bugs.
How to Create Your Own Cyclomatic Complexity Plot
I’d been holding off on trying this out since Devoxx (mid November last year) because I thought it would be complicated and time-consuming. But it turns out that wasn’t true at all. Creating the basic scripts I’ll show you here only took me an hour. Executing them was another hour. Keep in mind, that those scripts aren’t very advanced, fault tolerant or configurable. I invite any participation and expansion.
What you’ll need to get started:
- A command line client for your version control system. In my case I used the CollabNet Subversion Command-Line Client which was already on my system.
- Some way to calculate the cyclomatic complexity number (CCN) of your code. JavaNCSS is a great place to start, but there are many more tools.
- Tools to analyze the results. Adventurous types might feel like using an XSLT to process the XML that JavaNCSS can generate. I went with some very basic Python hacking and Excel.
Analyzing the Sources
I used a small Windows command line script to check out revisions ranging from 20000 to 35000 in increments of 150, which gave me 101 measurements. The script looks like this:
for /l %%r in (20000, 150, 35000) do (
  echo %%r
  svn co http://subversion/project/src/main/java@%%r project%%r
  c:\Java\Tools\javancss-32.53\bin\javancss -function -recursive c:\cyclomatic_compl\project%%r > ncss%%r.txt
  rmdir project%%r /s /q
)
It loops over the revision numbers we want. It checks out the revision, calculates the CCN and removes the directory. This will create 101 ncss.txt files with the JavaNCSS function-level reports for each revision.
That’s all there is to it.
Analyzing the Results
Next I wanted to get some of those numbers in Excel. It was about time I picked up Python again, so I used some of my rusty knowledge to come up with the following code:
import glob

def process(filename, fout):
  revision = filename[24:29]
  print(revision)
  fin = open(filename, encoding="utf8")
  lines = fin.readlines()
  fin.close()
  fout.write(revision + ";")
  for i in [-4, -3, -1]:
    line = lines[i]
    value = line[line.rindex(" ")+1:-1]
    value = value.replace(",","").replace(".",",")
    fout.write(value + ";")
  fout.write("\n")

print("processing")

fout= open("result.csv", "w", encoding="utf8")
path="C:\\cyclomatic_compl\\ncss*.txt"
for filename in glob.glob(path):
  process(filename, fout)
It’s not very pretty, but it manages its task: It loops over all the reports, extracts the values I’m interested in and creates a comma separated file. It also replaces the decimal separator due to an import bug in Excel.
Conclusion
With a little bit of glue code, it’s fairly easy to get a feeling of how your projects complexity evolves over time. What you do with those measurements is up to you.
